We all know we’ve seen kids who “definitely have sensory issues.” We all also know many people (doctors and other medical professionals included) who think that Sensory Processing Disorder isn’t valid and there’s not enough evidence to prove otherwise.
Well, there are studies that have investigated biological and physiological functions comparing those with sensory processing disorder and those without that have in fact showed–it’s a thing. Examples of measures studies included are responses to electrodermal activity as well as imaging of white matter in the brain. Below is a review of a study that analyzed differences in white matter microstructures and how they relate to auditory and tactile processing in typically developing children vs. those with a sensory processing disorder.
Article Details
Journal
Frontiers of Neuroanatomy (SNIP score 0.961) See this post for explanations of SNIP scores and levels of evidence used.
Article Title
White Matter Microstructure is Associated with Auditory and Tactile Processing in Children with and without Sensory Processing Disorder.
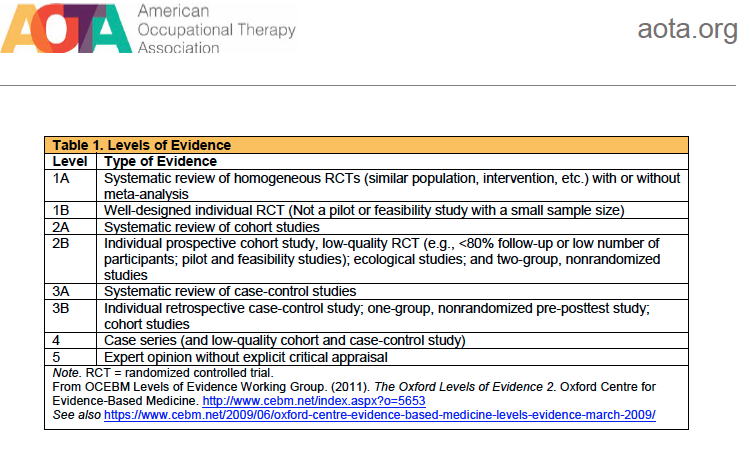
Level of Evidence
- 1A Systematic review of homogenous RCTS
- 1B Well-designed individual RCT
- 2A Systematic review of cohort studies
- 2B Individual prospective cohort study, low quality RCT, ecological studies; and two group, non-randomized studies
- 3A Systematic review of case-control studies
- 3B Individual retrospective case-control study; one-group, non-randomized pre-post test study; cohort studies
- 4 Case series (and low-quality cohort and case control study)
- 5 Expert opinion without explicit critical appraisal
Methods
MRI Measurements of Sensory Processing
Chang et al. 2016 used diffusion tensor imaging with an MRI to compare white matter microstructure between a group of 41 typically developing children (28 male 13 female) and 40 children with a diagnosis of sensory processing disorder (32 male 8 female).
They used measures of fractional anisotropy to quantify movement in white matter microstructure while mean diffusivity indicated white matter lesions on MRIs and radial diffusivity measured axonal/myelin damage on the MRIs.
Parent and Performance Measures of Sensory Processing
Parents of children in both groups completed the Tactile and Auditory Processing subtests of The Sensory Profile. Researchers used these in addition to the Acoustic Index of Differential Screening Test for Processing and the Graphesthesia subtest of Sensory Integration Praxis Test. These provided both parent reported and objective measures of childrens’ sensory processing performance.
Investigators ran statistical analyses of the above measures (both MRI imaging and performance on parent report and objective assessments), accounting for differences in age and gender.
What They Found
Researchers found statistically significant evidence that typically developing children have more white matter than those with sensory processing disorders per the fractional anisotropy measurements and analyses. Also statistically significant was that the white matter in children with SPD was more damaged than typically developing children, per the analysis of mean diffusivity and radial diffusivity.
How White Matter Impacts Graphesthesia
The movement in white matter activity (measured with FA) as related to performance on the graphesthesia subtest of the Sensory Integration Praxis Test was statistically significantly related for 16 of 25 assessed areas of the brain. FA relation to parent rating on the Sensory Profile was statistically significant for 12 of 25 areas of the brain that were assessed.
How White Matter Impacts Auditory Processing
The movement in white matter activity (measured with FA) as related to performance on the Acoustic Index of Differential Screening Test for Processing was statistically significantly related for 23 of 25 assessed areas of the brain! FA relation to parent rating on the Sensory Profile was statistically significant for 6 of 25 areas of the brain that were assessed.
Where the White Matter Impacts Auditory Processing
Both the sensory profile auditory score and Acoustic Index of Differential Screening Test for Processing are associated with white matter activity in the posterior thalamic region (PTR), which contains the primary auditory projection pathway.
Things to Consider
So, good news that researchers are developing methods to physiologically quantify and demonstrate differences between typically developing children and those with Sensory Processing Disorder!
Keep in mind while applying this study to those with whom you work that it looked at children with SPD without other comorbidities (such as an Autism Spectrum Disorder). An SPD diagnosis from a community based OT and Definite Difference Scores in at least one of these subtests on the Sensory Profile (tactile, auditory, multisensory or visual) placed children in the SPD group.
Many Diagnoses or Factors Can Mimic Sensory Processing
I don’t know about you…but I have definitely encountered children who I think do not have SPD although they have an SPD diagnosis or rate as definite difference across many subtests of the Sensory Profile. I’m talking about kids with anxiety or ADHD for whom parents attribute any atypical behaviors to the sensory processing factor. I know it’s relevant, but it’s not always the main contributor to a child’s behavior in my opinion.
Related to that thought is to keep in mind that the analyses in this study showed that parent ratings were less accurate of a predictor of performance on the graphesthesia and Acoustic Index of Differential Screening Test than the MRI measures. I bring this up to remind you that your clinical reasoning is a valid component in making decisions about treatment. Parents are sometimes biased in their ratings of how sensory processing impacts behaviors.
MRIs for everyone?
So far as the use of these imaging techniques for diagnosis of SPD? I don’t think we need to be sure a child has structural evidence to justify outpatient occupational therapy services. I do think this tool could prove valuable when assessing targeted interventions. It could provide information of how they can impact white matter changes as well as functional gains for the child.
Reference
Chang Y-S, Gratiot M, Owen JP, Brandes-Aitken A, Desai SS, Hill SS, Arnett AB, Harris J,
Marco EJ and Mukherjee P (2016) White Matter Microstructure is Associated with
Auditory and Tactile Processing in Children with and without Sensory Processing Disorder. Front. Neuroanat. 9:169. doi: 10.3389/fnana.2015.00169.